January–June 2026 · CEO Financial Report · Prepared September 9, 2026
Dr. Ronda Sharman
Life Care Chiropractic and Wellness Center, LLC · Waldorf, Maryland
★ Leader Phase · Use associate-led capacity and a role-owned operating system to create Freedom of Time
Avg. Monthly Income
$87,316
Avg. Net Income
$19,049
Net Margin
21.8%
Waterline
$91,023
Cash at Jun. 30
$9,937
△
Data-integrity priority: BlueIQ is not yet installed, so verified new-patient acquisition cost, lead conversion, starts, ACV, and LTV are unavailable. Install BlueIQ before making channel-level marketing decisions or assigning team conversion goals.
Financial reporting range: January–June 2026
Controls update the P&L-based scorecard. The Waterline remains a monthly operating target based on current average overhead.
CEO Readout
Financial strength
The practice is one Leader Phase move away from Waterline
Average monthly income is $87,315.72 with a reported 21.8% net margin. The corrected $91,022.79 Leader Waterline is only $3,707.07 away, but the real work is rebalancing Labor and OpEx while funding measured associate-led growth.
Accounting & cash management
Cash discipline must become part of the operating system
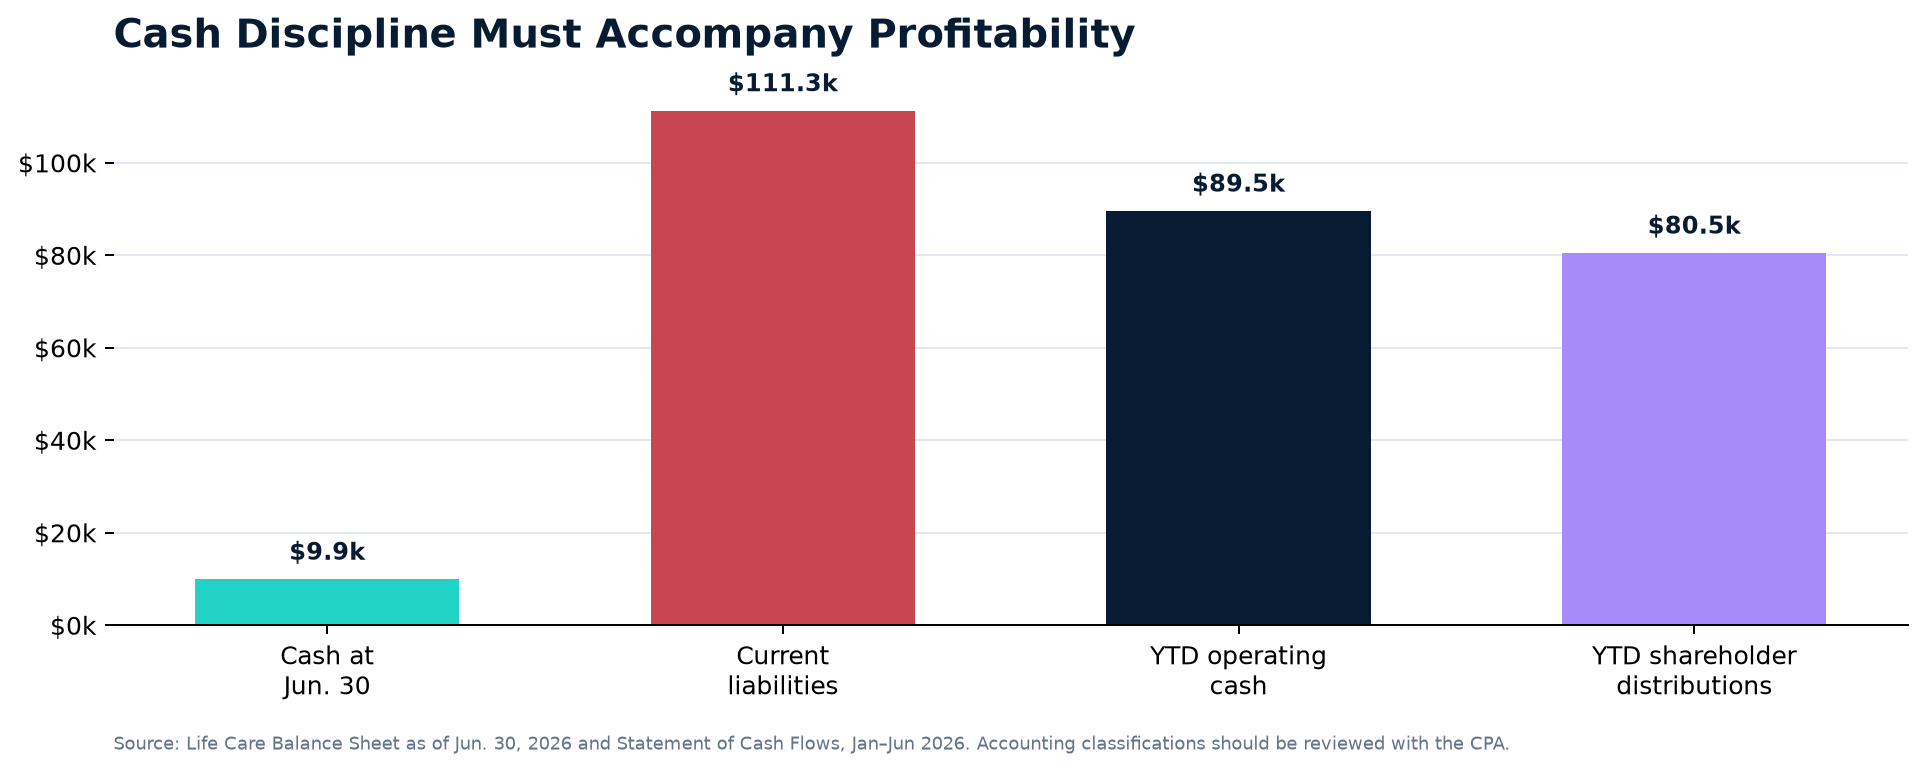
June 30 cash was $9,936.76 against reported current liabilities of $111,255.78. The reported 1.58x current ratio is driven primarily by a shareholder-loan asset; validate classifications, debt service, and distribution guardrails with the CPA.
Growth visibility
One associate needs a measurable shared scorecard
Public marketing shows 842 Facebook followers, 52 reviews, and a 96% recommendation rate. Without BlueIQ, the team cannot see new-patient acquisition, conversion, retention, or associate capacity—so the owner is still carrying too much of the growth system.
January–June 2026 Financial Scorecard
Metric basis: the supplied accrual-basis P&L reports gross profit equal to revenue because no separate COGS section appears. Expense percentages are calculated as a percentage of reported gross profit. Product and medical-supply classifications should be confirmed with the bookkeeper/CPA.
Financial Lever
Period Amount
Actual
Leader Target
Assessment
Revenue / Reported Gross Profit
$523,894.32
—
—
P&L basis
Marketing
$12,618.18
2.4% of gross profit
≤15%
Measured capacity available
Labor
$219,062.55
41.8% of gross profit
≤35%
Significantly above
Other Operating Expense
$177,921.79
34.0% of gross profit
≤25%
Significantly above
Total Expenses
$409,602.52
78.2% of gross profit
≤75%
Slightly above
Net Income
$114,291.80
21.8% of gross profit
≥25%
Slightly below
Expense Mix and Operating Leverage
What the Money Model Is Saying
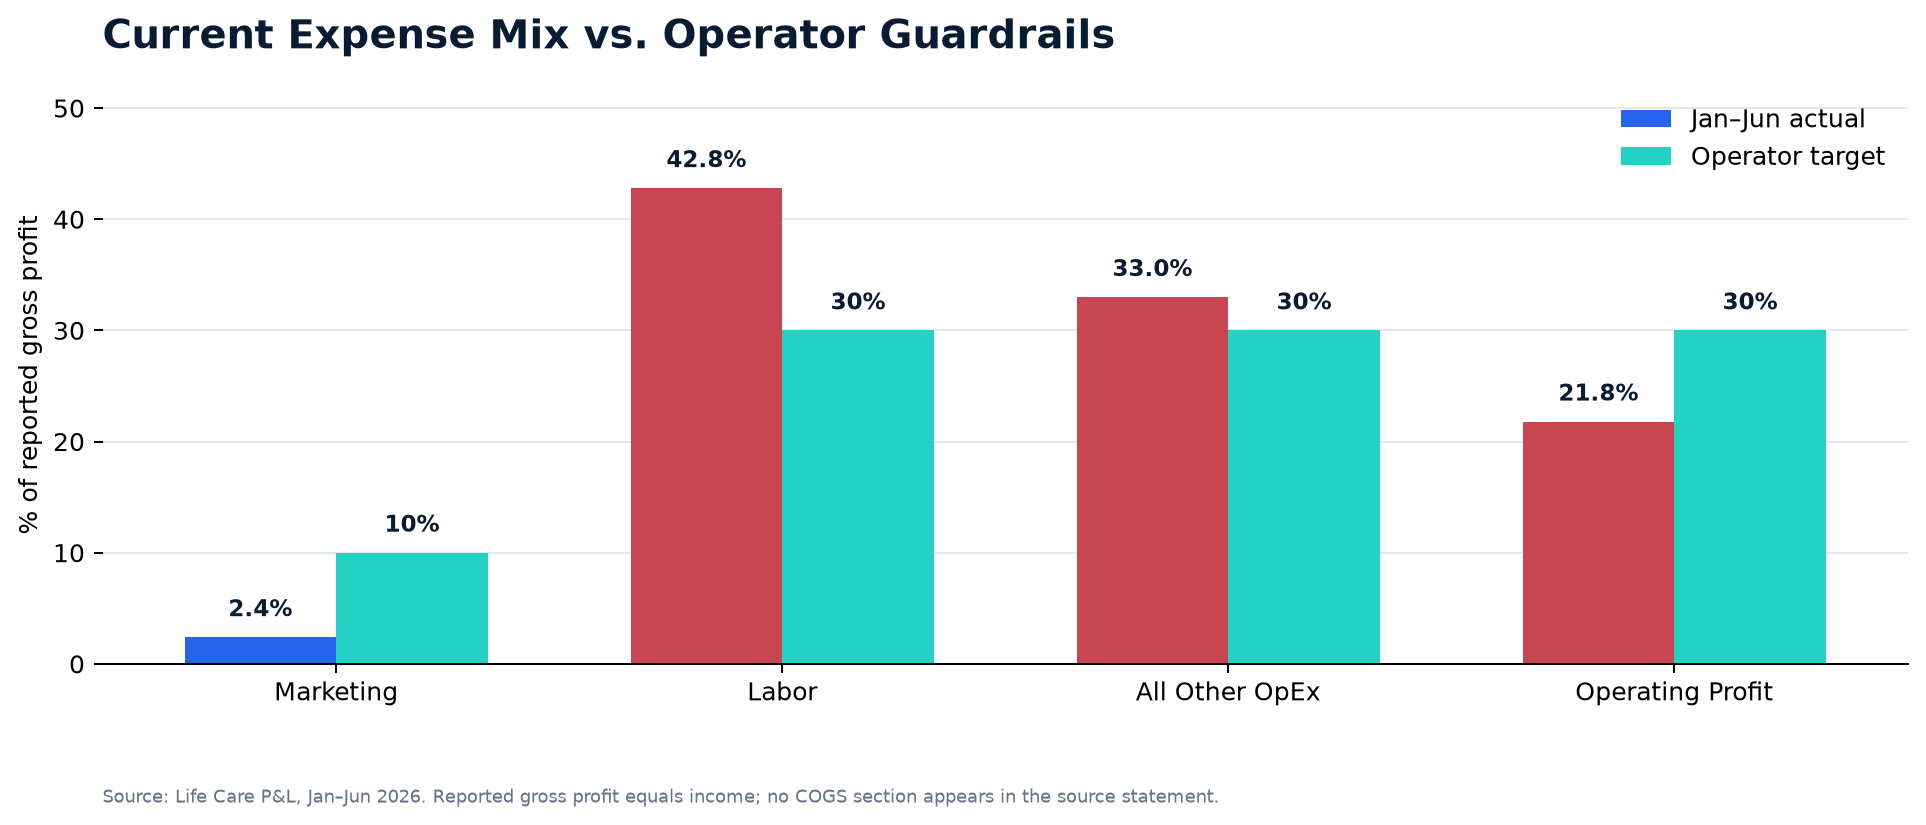
Labor at 41.8% is 6.8 percentage points above the Leader guardrail. With one associate already installed, the priority is not simply adding or cutting labor; it is measuring provider capacity, clinical output, compensation, and the delegation of non-doctor work.
All Other OpEx at 34.0% is 9.0 percentage points above the Leader guardrail. Start with recurring consultants, billing service, travel, product classification, software, and expense ownership.
Marketing is only 2.4% of reported gross profit. Preserve the Leader Phase 15% capacity for acquisition only after source, conversion, NPAC, and LTV data are measured.
The target is a sustainable 75% overhead / 25% operating-profit Leader model that frees the owner to lead rather than cover every clinical and operational gap.
Account classification is a decision-quality issue: confirm whether Product and Medical Supplies belong in COGS.
Expense Drilldown — What Requires a CEO Review
Monthly averages shown below are derived from the January–June 2026 P&L. These are decision prompts, not an instruction to cut a category without validating service impact, contracts, and accounting treatment.
Classification check: The source P&L reports Product and Medical Supplies below gross profit. Confirm with the bookkeeper/CPA whether all or part should be reclassified to COGS. This will change gross-profit mix analysis, but it does not change total expenses or the total-expense Waterline calculation.
Waterline: The Revenue Target That Funds the Model
Leader Phase Waterline
$91,022.79
This is not the overhead floor. It is the monthly revenue target needed to fund the current $68,267.09 average expense floor while delivering the Leader model’s 25% operating-profit target.
Current avg. monthly income$87,315.72
Gap to Waterline$3,707.07
Growth required from average4.2%
Overhead floor at Waterline$68,267.09
Target operating profit at Waterline$22,755.70
Profit Waterfall — The Reward System After Waterline
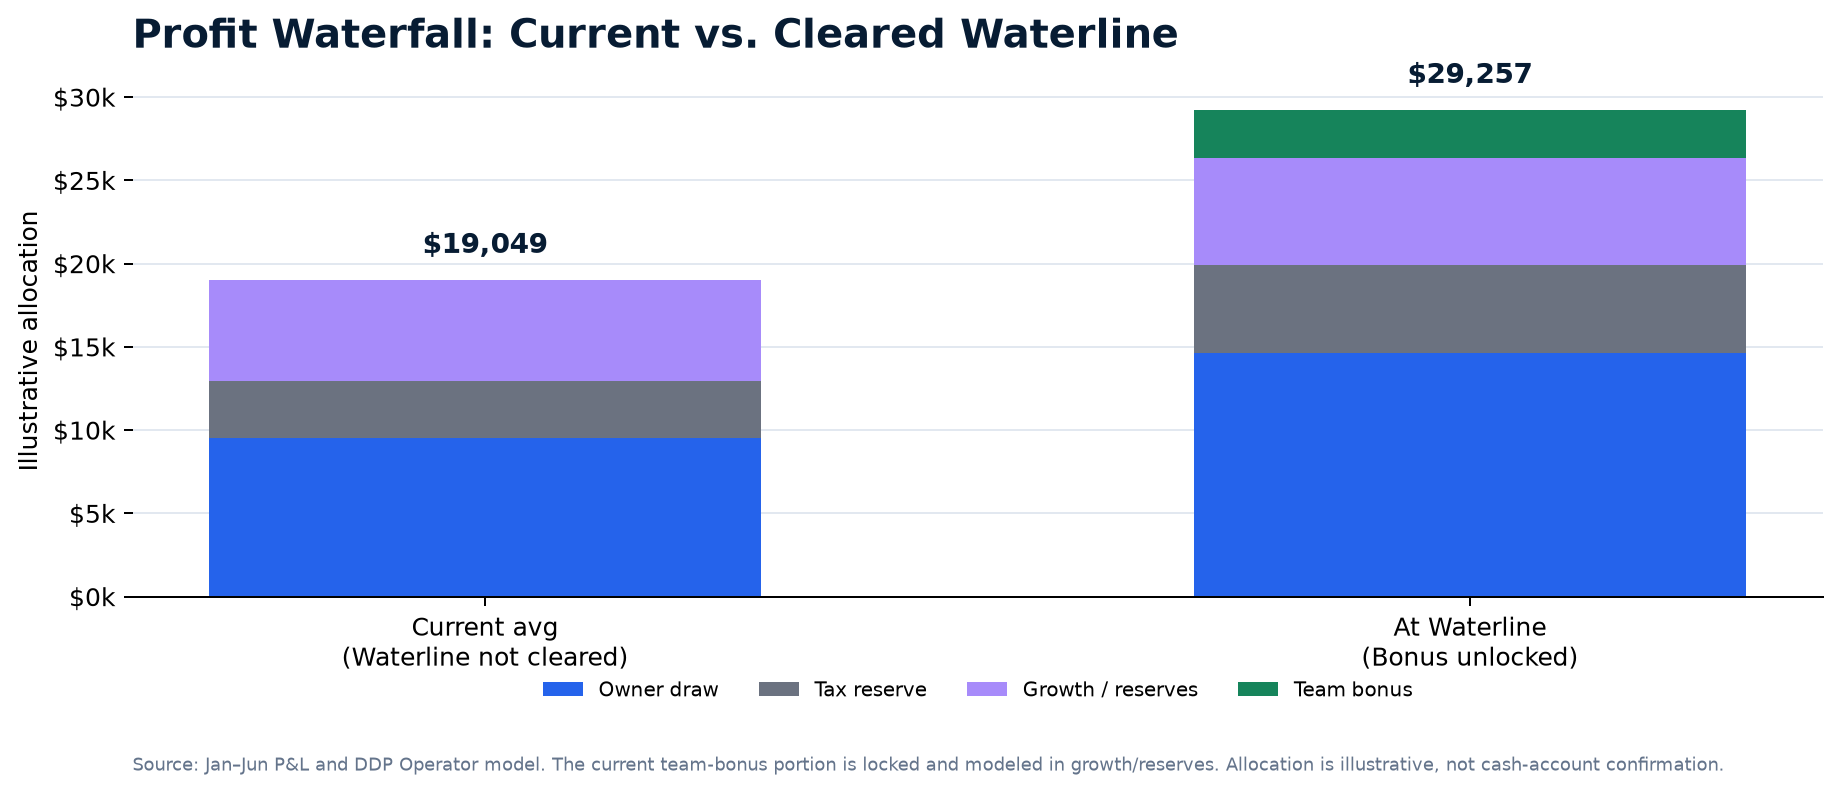
The 50/18/22/10 allocation is a management framework applied to profit after Waterline clearance; tax needs and cash-account transfers should be confirmed with the practice CPA.
50%
Owner DrawAt Leader Waterline
$11,377.85
18%
Tax ReserveConsult CPA for tax allocation
$4,096.03
22%
Growth AccountMeasured associate-led growth and reserves
$5,006.25
10%
Team BonusUnlocked by Leader Waterline clearance
$2,275.57
Balance Sheet and Cash Position
June 30, 2026 Cash Context
Cash at June 30
$9,936.76
Reported current assets
$175,997.02
Shareholder loan asset
$164,017.37
Current liabilities
$111,255.78
Reported current ratio
1.58x
Cash coverage of current liabilities
8.9%
YTD operating cash flow
$89,544.35
YTD shareholder distributions
-$80,462.97
This does not judge shareholder distributions. It identifies the need for explicit cash, tax, debt-service, and distribution guardrails. Confirm the shareholder loan and liability classifications with the bookkeeper/CPA.
BlueIQ Operating Scoreboard
What cannot be responsibly calculated today: NPAC/CAC, lead-to-scheduled rate, show rate, completed new-patient count, starts, ACV, care-plan acceptance, source-level ROI, and LTV. BlueIQ plus source capture turns these gaps into a shared weekly scorecard.
Metric
Current Status
First Definition / Owner
CEO Interpretation
Total Collections
Available from P&L / QuickBooks
Company-wide visible metric
The constant financial outcome tracked weekly against the $91,023 Leader Waterline.
Provider Capacity & Collections
Not yet measured by provider
Production Manager / Associate DC
Track visits, production, collections, retention, and schedule capacity by doctor to create Freedom of Time.
Scheduled & Completed New Patients
Not yet measured
Front Desk Key
Needed to identify where inquiry volume or appointment execution is breaking.
Starts & ACV
Not yet measured
Exam & Case Acceptance Key
Needed to validate the protocol, patient education, and case-acceptance process.
NPAC / CAC
Not yet measurable
Marketing Key
Paid spend by source ÷ completed new patients from that source.
Retention & Referrals
Not yet measured
Front Desk / Production Keys
Track reactivations, reviews, referrals, and collected revenue by cohort.
The 6 Key Systems
01
Leadership Key
Run the Leader Cadence: CEO time blocks, an associate-led clinical scorecard, weekly accountability, and role-owned outcomes.
02
Office Manager Key
Equip Diana Jimenez as the 90-day Implementation Lead for task-board follow-through.
Standardize both doctors’ education, report-of-findings, care-plan recommendation, and handoff around the signature protocol.
05
Production Manager Key
Manage capacity, visits, production, collections, retention, and protocol delivery by provider so the associate creates freedom—not more owner oversight.
06
Marketing Key
Turn one flagship protocol into source-coded content, events, referral campaigns, and measured acquisition.
90-Day CEO Action Plan
Days 1–30
Leader scorecard + associate capacity
Install BlueIQ and connect QuickBooks; reconcile the chart of accounts; establish CEO, cash, Data Waterfall, and by-provider scorecards; map associate capacity and non-doctor work; select the flagship protocol.
Days 31–60
Standardize the associate-led patient pathway
Run Front Desk, Exam & Case Acceptance, Production, and claims-follow-up sprints. Document the signature protocol for both doctors. Capture source, lead, scheduled, completed exam, start, ACV, retention, and collections data by provider.
Days 61–90
Create Freedom of Time through role ownership
Launch the recurring protocol-based campaign, run retain/refer sprints, move routine clinical and operational decisions to named owners, protect CEO time blocks, and choose the next CKPI and Pryme Mover from the scorecard.
CEO Summary
Life Care Chiropractic is a Leader Phase practice with one associate already in place; the next constraint is turning that capacity into Freedom of Time. It has an established revenue base, strong public trust signals, and clinical capacity beyond the owner. The immediate job is to convert that foundation into a role-owned system: run a by-provider production and retention cadence, stabilize Labor and OpEx leverage, establish a cash and distribution cadence, define one repeatable protocol that is known beyond the provider, and make the Data Waterfall visible through BlueIQ. The fastest path to the $91,022.79 Leader Waterline is not indiscriminate marketing spend. It is measuring the funnel, moving routine work and clinical ownership to the associate/team where appropriate, reducing Labor and OpEx as a share of gross profit, and then deploying the available acquisition capacity around a signature protocol.
Basis & confidence: This report uses the supplied accrual-basis January–June 2026 P&L, Balance Sheet as of June 30, 2026, Statement of Cash Flows for January–June 2026, new-member intake form, and public website/Facebook review. Calculations are derived from those files. P&L and cash figures are high confidence subject to accounting classification; funnel, CAC/NPAC, conversion, ACV, LTV, and channel ROI are unavailable until BlueIQ and source capture are installed.
 The Data Driven Practice