January–June 2026 · CEO Financial Report · Prepared September 9, 2026
Dr. Ronda Sharman
Life Care Chiropractic and Wellness Center, LLC · Waldorf, Maryland
★ Operator Phase · Build repeatable profitability before expanding into Freedom of Time
Avg. Monthly Income
$87,316
Avg. Net Income
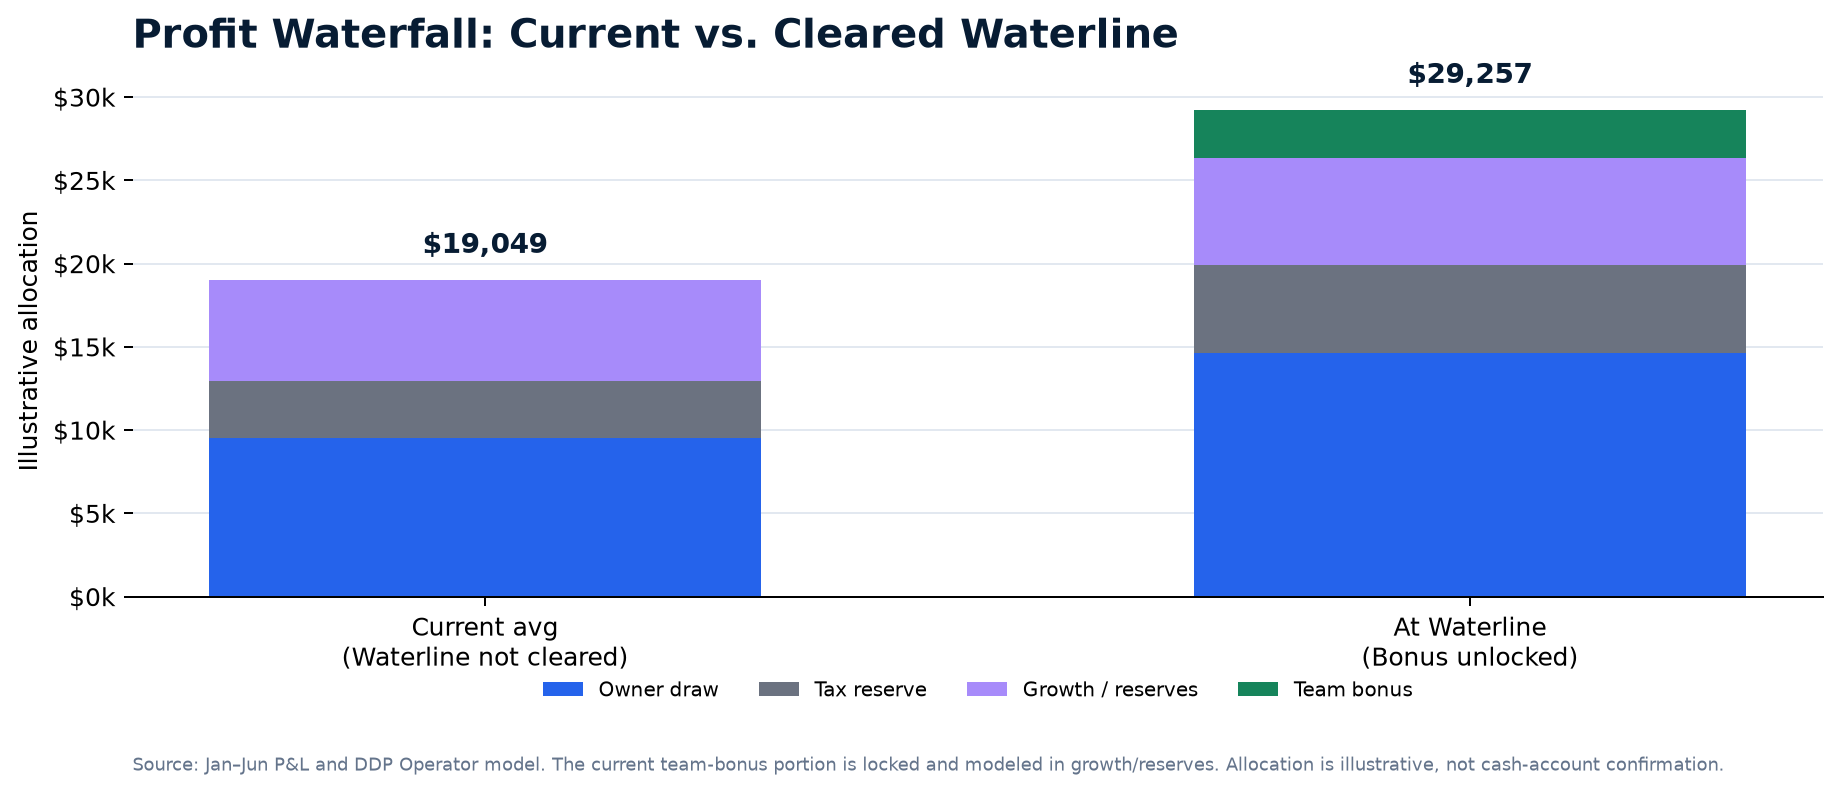
$19,049
Net Margin
21.8%
Waterline
$97,524
Cash at Jun. 30
$9,937
△
Data-integrity priority: BlueIQ is not yet installed, so verified new-patient acquisition cost, lead conversion, starts, ACV, and LTV are unavailable. Install BlueIQ before making channel-level marketing decisions or assigning team conversion goals.
Financial reporting range: January–June 2026
Controls update the P&L-based scorecard. The Waterline remains a monthly operating target based on current average overhead.
CEO Readout
Financial strength
Revenue is established; operating leverage is the next constraint
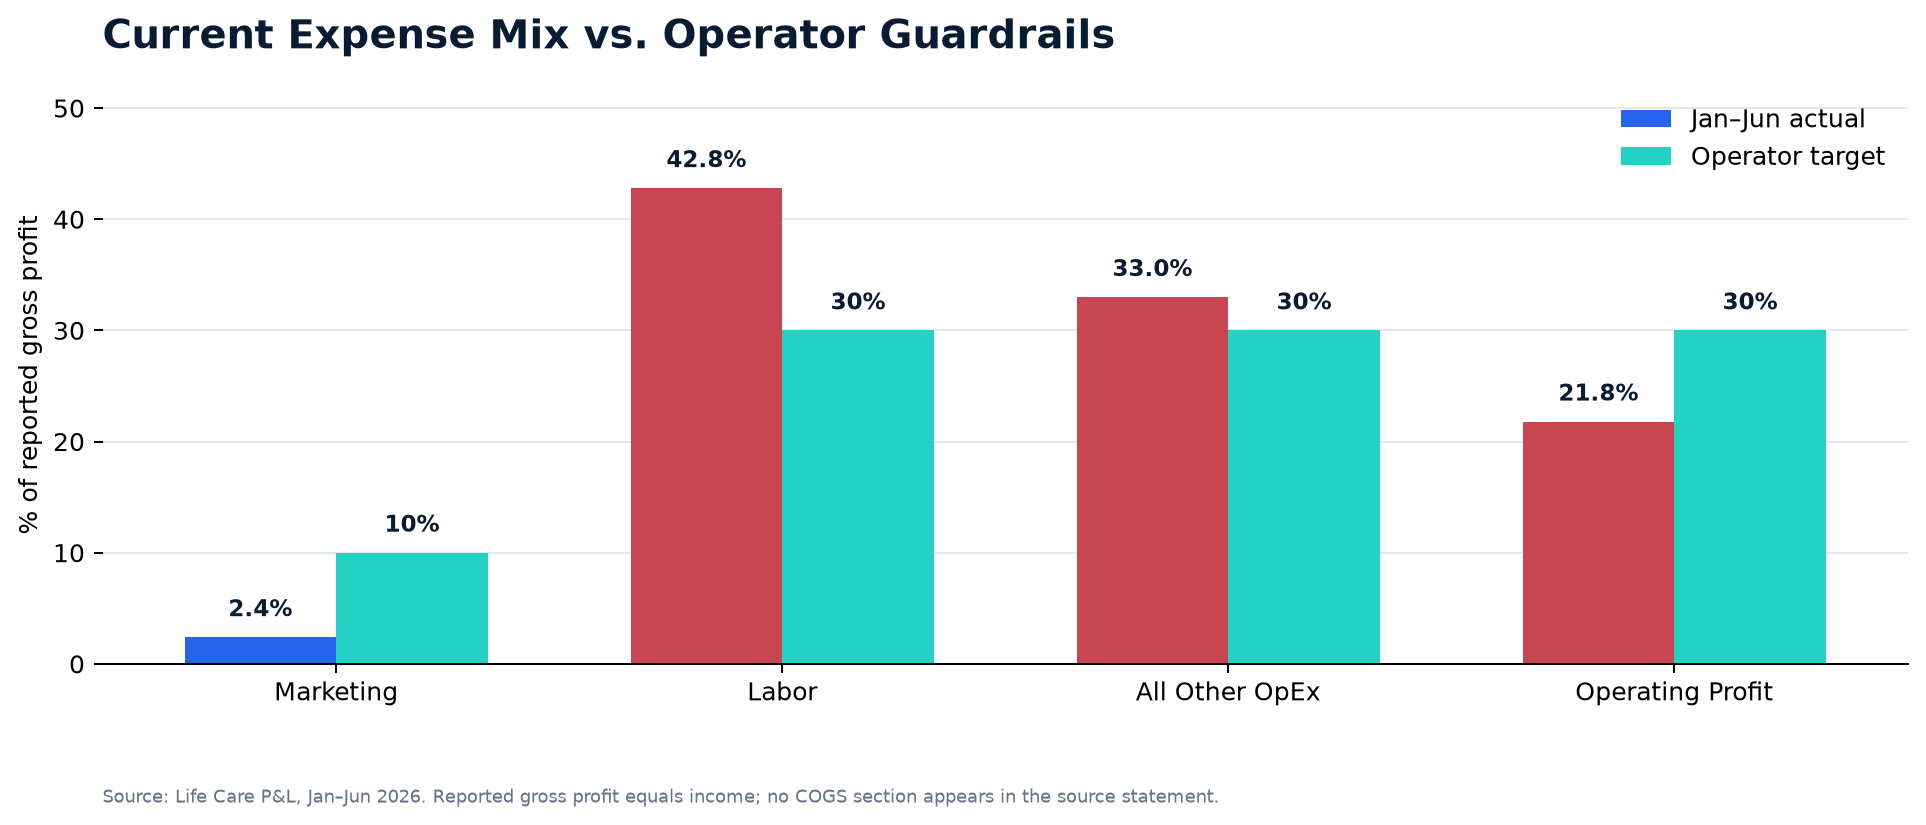
Average monthly income is $87,315.72 with a reported 21.8% net margin. The practice is close to the $97,524.41 Operator Waterline, but Labor and All Other OpEx consume more than the Operator model allows.
Accounting & cash management
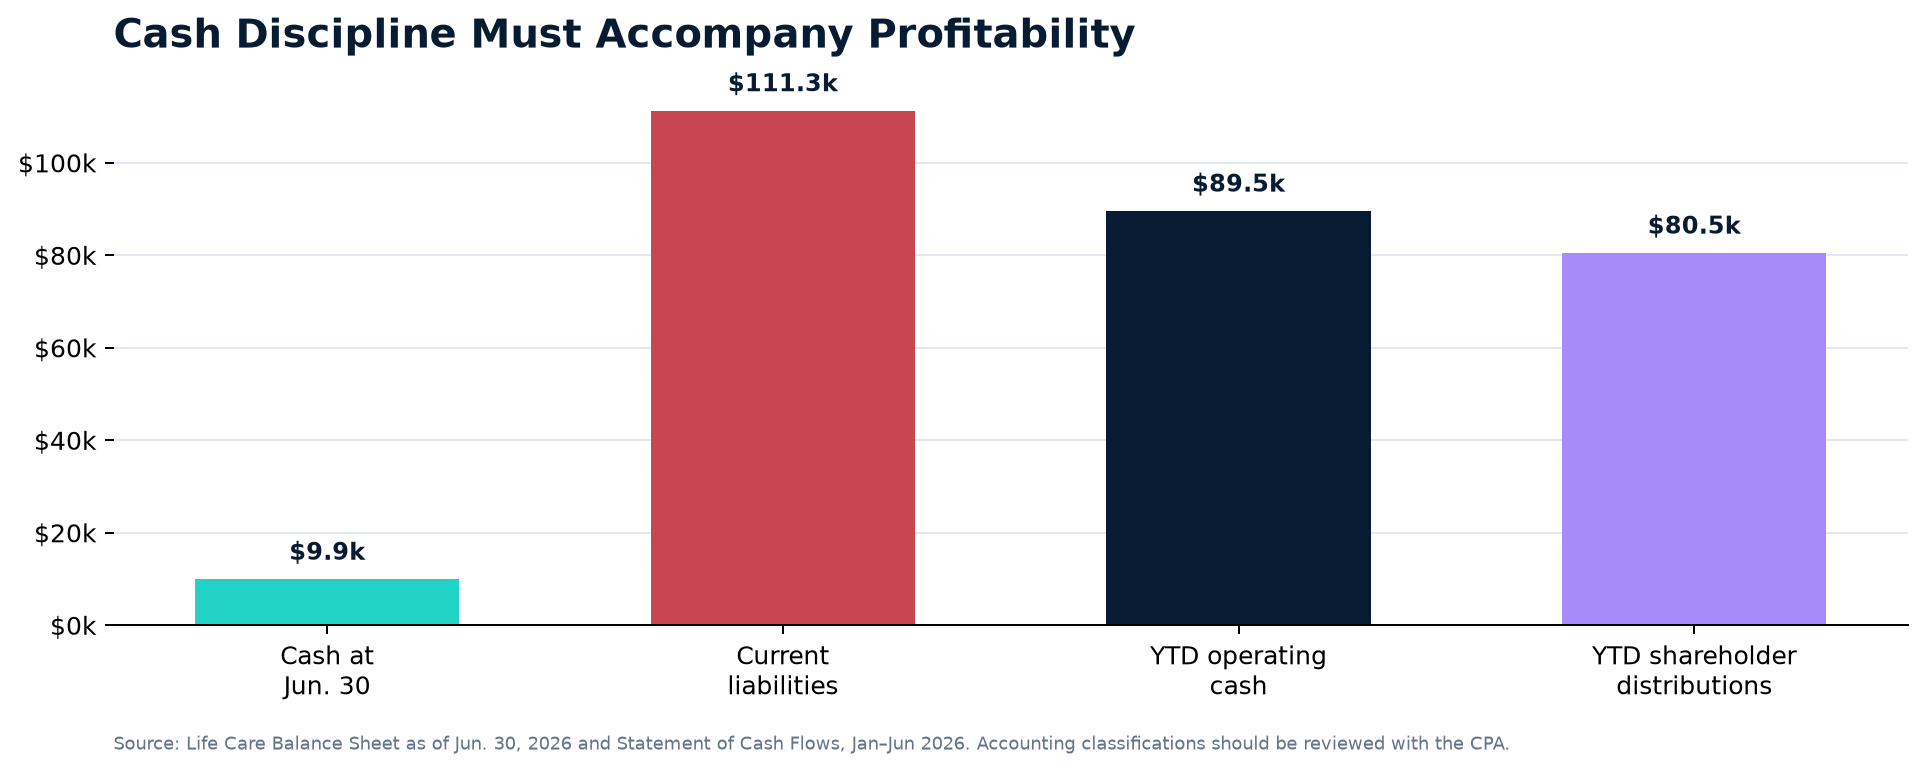
Cash discipline must become part of the operating system
June 30 cash was $9,936.76 against reported current liabilities of $111,255.78. The reported 1.58x current ratio is driven primarily by a shareholder-loan asset; validate classifications, debt service, and distribution guardrails with the CPA.
Growth visibility
The practice has trust signals but no measurable funnel
Public marketing shows 842 Facebook followers, 52 reviews, and a 96% recommendation rate. Without BlueIQ and source capture, the team cannot see which marketing creates completed new patients, starts, or collected revenue.
January–June 2026 Financial Scorecard
Metric basis: the supplied accrual-basis P&L reports gross profit equal to revenue because no separate COGS section appears. Expense percentages are calculated as a percentage of reported gross profit. Product and medical-supply classifications should be confirmed with the bookkeeper/CPA.
Financial Lever
Period Amount
Actual
Operator Target
Assessment
Revenue / Reported Gross Profit
$523,894.32
—
—
P&L basis
Marketing
$12,618.18
2.4% of gross profit
≤10%
Capacity available
Labor
$219,062.55
41.8% of gross profit
≤30%
Above guardrail
Other Operating Expense
$177,921.79
34.0% of gross profit
≤30%
Above guardrail
Total Expenses
$409,602.52
78.2% of gross profit
≤70%
Above guardrail
Net Income
$114,291.80
21.8% of gross profit
≥30%
Below target
Expense Mix and Operating Leverage
What the Money Model Is Saying
Labor at 41.8% is the primary economic constraint—11.8 percentage points above the Operator guardrail. Validate staffing, provider and subcontractor compensation, benefit design, and assignment of work before adding headcount.
All Other OpEx at 34.0% is 4.0 percentage points above the Operator guardrail. Start with recurring consultants, billing service, travel, product classification, software, and expense ownership.
Marketing is only 2.4% of reported gross profit; do not deploy unused capacity until the acquisition funnel is measured.
The focus is not blanket cost cutting. It is building a sustainable 70% overhead / 30% operating-profit model.
Account classification is a decision-quality issue: confirm whether Product and Medical Supplies belong in COGS.
Expense Drilldown — What Requires a CEO Review
Monthly averages shown below are derived from the January–June 2026 P&L. These are decision prompts, not an instruction to cut a category without validating service impact, contracts, and accounting treatment.
Classification check: The source P&L reports Product and Medical Supplies below gross profit. Confirm with the bookkeeper/CPA whether all or part should be reclassified to COGS. This will change gross-profit mix analysis, but it does not change total expenses or the total-expense Waterline calculation.
Waterline: The Revenue Target That Funds the Model
Operator Phase Waterline
$97,524.41
This is not the overhead floor. It is the total monthly revenue target needed to fund the current $68,267.09 average expense floor and retain the Operator model’s 30% operating-profit target.
Current avg. monthly income$87,315.72
Gap to Waterline$10,208.69
Growth required from average11.7%
Overhead floor at Waterline$68,267.09
Target operating profit at Waterline$29,257.32
Profit Waterfall — The Reward System After Waterline
The 50/18/22/10 allocation is a management framework applied to profit after Waterline clearance; tax needs and cash-account transfers should be confirmed with the practice CPA.
50%
Owner DrawAt Waterline
$14,628.66
18%
Tax ReserveConsult CPA for tax allocation
$5,266.32
22%
Growth AccountMeasured growth and reserves
$6,436.61
10%
Team BonusUnlocked by Waterline clearance
$2,925.73
Balance Sheet and Cash Position
June 30, 2026 Cash Context
Cash at June 30
$9,936.76
Reported current assets
$175,997.02
Shareholder loan asset
$164,017.37
Current liabilities
$111,255.78
Reported current ratio
1.58x
Cash coverage of current liabilities
8.9%
YTD operating cash flow
$89,544.35
YTD shareholder distributions
-$80,462.97
This does not judge shareholder distributions. It identifies the need for explicit cash, tax, debt-service, and distribution guardrails. Confirm the shareholder loan and liability classifications with the bookkeeper/CPA.
BlueIQ Operating Scoreboard
What cannot be responsibly calculated today: NPAC/CAC, lead-to-scheduled rate, show rate, completed new-patient count, starts, ACV, care-plan acceptance, source-level ROI, and LTV. BlueIQ plus source capture turns these gaps into a shared weekly scorecard.
Metric
Current Status
First Definition / Owner
CEO Interpretation
Total Collections
Available from P&L / QuickBooks
Company-wide visible metric
The constant financial outcome tracked weekly against the $97,524 Waterline.
Scheduled & Completed New Patients
Not yet measured
Front Desk Key
Needed to identify where inquiry volume or appointment execution is breaking.
Starts & ACV
Not yet measured
Exam & Case Acceptance Key
Needed to validate the protocol, patient education, and case-acceptance process.
NPAC / CAC
Not yet measurable
Marketing Key
Paid spend by source ÷ completed new patients from that source.
Retention & Referrals
Not yet measured
Front Desk / Production Keys
Track reactivations, reviews, referrals, and collected revenue by cohort.
The 6 Key Systems
01
Leadership Key
Clarify CEO vs. Implementer ownership, meeting rhythm, and scorecard rules.
02
Office Manager Key
Equip Diana Jimenez as the 90-day Implementation Lead for task-board follow-through.
Standardize education, report-of-findings, care-plan recommendation, and handoff around the signature protocol.
05
Production Manager Key
Document capacity, patient progress, outcomes, and treatment-delivery standards for associate readiness.
06
Marketing Key
Turn one flagship protocol into source-coded content, events, referral campaigns, and measured acquisition.
90-Day CEO Action Plan
Days 1–30
Financial clarity + scoreboard
Install BlueIQ and connect QuickBooks; reconcile the chart of accounts; establish the CEO, cash, and Data Waterfall scorecards; review consultant, staffing, billing, and expense categories; select the flagship protocol.
Days 31–60
Conversion + fulfillment systems
Run Front Desk, Exam & Case Acceptance, and claims-follow-up sprints. Document the signature patient pathway. Capture baseline source, lead, scheduled, completed exam, start, ACV, and collections data. Align bonus rules to Waterline clearance.
Days 61–90
Measured growth + capacity
Launch a recurring protocol-based campaign/event, run production and retain/refer sprints, audit capacity and associate readiness, and choose the next quarterly CKPI and Pryme Mover using the scorecard.
CEO Summary
Life Care Chiropractic is not a broken practice; it is a capable practice whose next constraint is operating-system maturity. It has an established revenue base, strong public trust signals, and a clear CEO vision. The immediate job is to convert that foundation into a role-owned system: stabilize expense leverage, establish a cash and distribution cadence, define one repeatable protocol, and make the Data Waterfall visible to the team through BlueIQ. The fastest path to the $97,524 Waterline is not indiscriminate marketing spend. It is first measuring the funnel, reducing Labor and OpEx as a share of gross profit, and then deploying measured acquisition capacity around a signature protocol.
Basis & confidence: This report uses the supplied accrual-basis January–June 2026 P&L, Balance Sheet as of June 30, 2026, Statement of Cash Flows for January–June 2026, new-member intake form, and public website/Facebook review. Calculations are derived from those files. P&L and cash figures are high confidence subject to accounting classification; funnel, CAC/NPAC, conversion, ACV, LTV, and channel ROI are unavailable until BlueIQ and source capture are installed.
 The Data Driven Practice